
Share
Editor's Note - Updated May 2026: This post has been updated to reference the JBREC + Kiavi Q1 2026 Fix and Flip Survey, which shows how market conditions have evolved since Q3 2025, including a meaningful recovery in the FFMI, improved ARV outcomes, and a record rental pivot among active flippers. Read it here ->
The real estate market never stands still. For real estate investors (REIs) focused on fix-and-flip projects, staying ahead means understanding not just where the market is today, but where it could be headed tomorrow. The latest John Burns Research & Consulting + Kiavi Fix and Flip Survey for Q3 2025 offers a detailed snapshot of the current landscape, revealing both the headwinds and tailwinds shaping real estate investing right now.
Overall, the data shows some interesting shifts. The Fix-and-Flip Market Index (FFMI) contracted slightly to 56 from 57 the previous quarter, and it's down from 62 a year ago. That might sound concerning at first glance, but dig deeper and you'll find a market that is remaining fundamentally resilient.
Yes, weaker selling conditions and economic uncertainty are creating challenges. Rising inventory and higher rates are adding complexity to the equation. But here's what matters: real estate investors who understand these dynamics are still finding meaningful investment opportunities.
This post breaks down the recent JBREC + Kiavi Q3 2025 survey data to help you make smarter real estate investing decisions. We'll explore national trends, regional differences, investor sentiment, and what the future might hold. While some metrics show a cooling from last year's highs, the overall picture reveals a market that's adjusting rather than declining—and that could create openings for disciplined, data-driven REIs.
Understanding the Fix-and-Flip Market Index (FFMI)
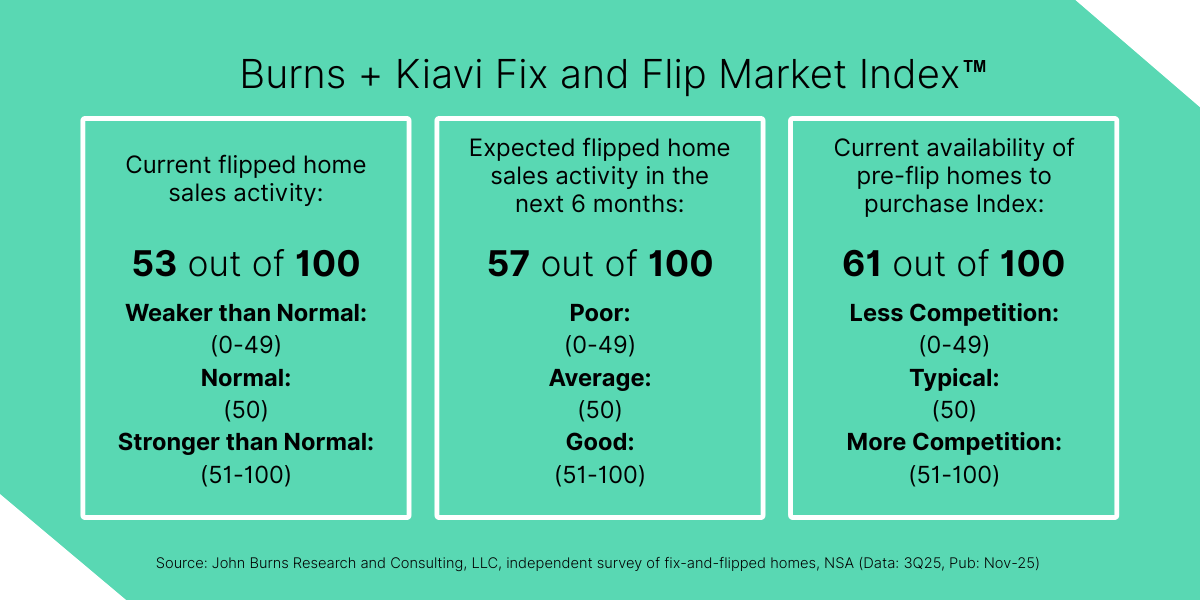
Think of the FFMI as the pulse of the national fix-and-flip market. This index measures overall health and sentiment among surveyed real estate investors actively working in this space.
The latest reading shows the index at 56 for 3Q25, down slightly from 57 in 2Q25 and 62 from the same quarter last year. While this represents a contraction, it's important to put that number in context. An index score above 50 still indicates expansion, meaning the market is growing—just at a more measured pace than before.
So, what's causing this shift? A few factors could be at play. In some markets, flippers are encountering tougher selling conditions as buyers remain cautious amid economic uncertainty. Rising inventory also means more competition for buyers. Additionally, high rates continue to affect affordability for end buyers, which could lengthen holding periods and impact profit margins.
Understanding these pressures could help frame the rest of the data we'll explore. The market isn't collapsing; it's recalibrating. For real estate investors, that means you should consider adjusting your strategies rather than waiting out the market entirely.
Trend #1: Home Prices and Renovation Costs
Let's talk numbers. The average fix-and-flip home price saw a -4% year-over-year decrease according to the JBREC + Kiavi survey data. While declining prices might initially seem like bad news, some real estate investors recognize this as a potential entry point. Lower acquisition costs could help improve your margin—if you manage the rest of your budget carefully.
Here's the catch: average renovation costs have climbed to $80K, the highest figure in the JBREC + Kiavi survey's history. That's a significant increase that could directly impact your bottom line. Rising material costs, labor shortages, and supply chain disruptions continue to push rehab budgets higher.
What does this mean for your real estate investing strategy? Accurate budgeting becomes even more important. When acquisition prices drop but renovation costs rise, your profit margin could get squeezed from both ends. You'll need to consider:
- Building in larger contingency buffers for unexpected costs
- Getting multiple contractor quotes and lock in affordable pricing where possible
- Scope reductions that maintain value but reduce costs
- Factoring longer timelines into your financial projections
The real estate investors who succeed in this environment are most likely those who maintain discipline in their deal analysis. That discounted purchase price probably won't save you if renovation overruns eat into your margins.
Trend #2: How Much Are Flippers Willing to Pay?
After-Repair Value (ARV) is central to fix-and-flip deal analysis. It’s the estimated market value of an investment property once renovations are complete. Most real estate investors use ARV to determine their maximum purchase price, calculating backward from this figure while considering renovation costs, holding costs, financing, and desired profit.
Here’s the basic equation:
ARV = Property Value Before Renovation + Value of Renovations
The JBREC + Kiavi survey showed that the average surveyed flippers' maximum percentage of ARV they're willing to pay has decreased to 64%, down from 66% last quarter. That two-point drop might seem small, but it could signal a meaningful shift toward caution.
What does this mean for you? Real estate investors are looking for better deals before making commitments. With renovation costs rising and selling conditions becoming trickier in some markets, having some extra room in your purchase price is a smart move. If you're considering an investment property, the survey data suggests taking a thoughtful and disciplined approach to your offer.
This more conservative approach to ARV percentages may reflect market realities. When uncertainty rises, smart investors widen their margins of safety. You're not being overly cautious by offering less—you're being strategic.
Kiavi Tip: Need help estimating a property’s potential? Tools like Kiavi’s ARV calculator make it easy to crunch the numbers.
Trend #3: Where to Invest? A Regional Look at Flip Prices
Real estate investing is inherently local, and the JBREC + Kiavi survey data suggests that regional dynamics could vary dramatically. Understanding these differences might help you identify where opportunities could be strongest.
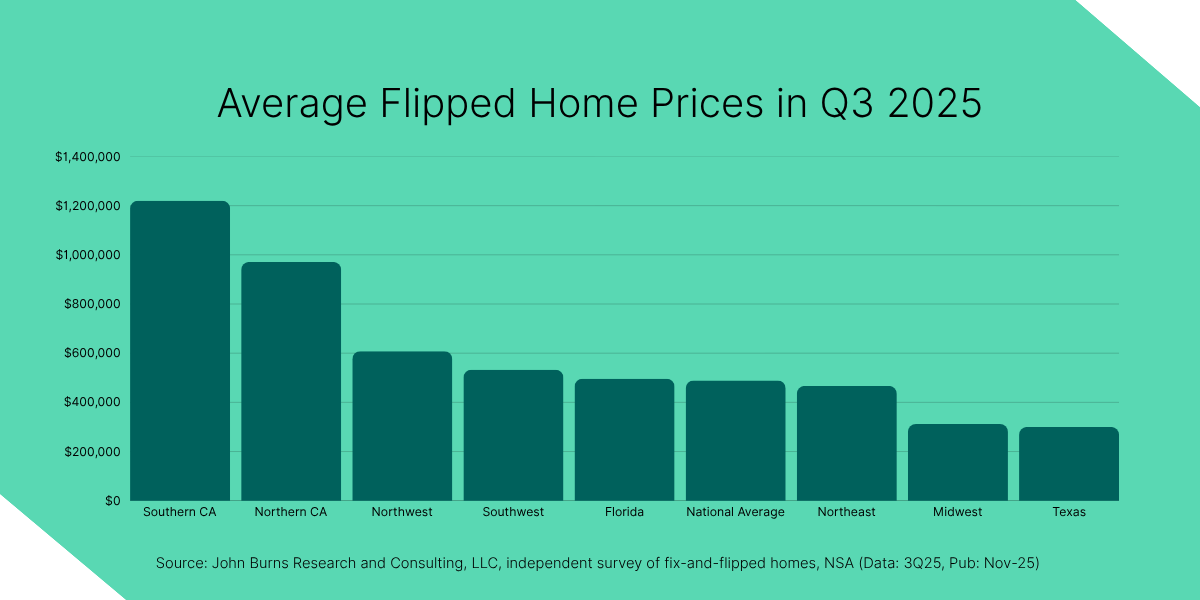
Regional Price Comparison: Average Flipped Home Prices in Q3 2025
- Southern California: $1.22M
- Northern California: $971K
- Northwest: $608K
- Southwest: $533K
- Florida: $496K
- National Average: $489K
- Northeast: $467K
- Midwest: $312K
- Texas: $300K
According to the survey, on the West Coast, particularly Southern California, average flipped home prices are over $1.2M. Northern California is close behind, at $971K. These markets may show higher absolute returns, but they could also require substantially more capital and present varied risk levels.
In contrast, Texas and the Midwest have average prices around $300K-$312K. While these markets might offer lower gross profits per deal, they could also have lower barriers to entry and potentially quicker inventory turnover.
Other regions appear to fall within a more balanced range. Florida's average is near the national average at $496K, followed by the Northeast at $467K. The Northwest and Southwest also sit comfortably within this middle range.
Strategic Implications
How can you leverage this regional data in your real estate investing approach? Consider your capital availability and risk tolerance. High-value markets like Southern California might generate larger profits per flip, but they could tie up more capital for longer periods and leave less room for error.
According to the JBREC + Kiavi survey, mid-range markets around the national average could offer a balance of returns and risk for many real estate investors. Lower-priced markets in the Midwest and Texas might support higher velocity strategies if you have systems in place to handle multiple projects simultaneously.
Above all, consider aligning your strategy with local market dynamics. A flip that works in Texas won't necessarily translate to California, and vice versa. Understanding these regional nuances is important for successful real estate investing.
Trend #4: Real Estate Investor Sentiment and Sales Forecasts
Market sentiment provides insights into investor expectations and strategies. The JBREC + Kiavi survey shows 31% of flippers anticipate "Good" sales in the next six months. While stable quarter-over-quarter and down 9 points from last year, it reflects ongoing real estate investor confidence.
The Flipped Home Sales Index dropped to 53, its lowest since Q4 2022, signaling some market cooling. However, it’s important to remember that an index above 50 still indicates overall market growth.
These findings highlight a shifting market. Many flippers remain optimistic, finding opportunities despite challenges like longer listing times or pricing adjustments. For investors, this dynamic environment may require adaptability and strategic planning to capitalize effectively.
Trend #5: Tighter Inventory for Fix-and-Flips
Finding the right investment property to flip is half the battle. According to the JBREC + Kiavi fix-and-flip survey, the Availability of Pre-Flip Homes to Purchase Index decreased 6 points year-over-year to 61 out of 100.
Here's what that number means: a score above 50 indicates expansion or availability. At 61, homes to flip are still available—the market hasn't dried up. However, the year-over-year decline signals that inventory is tighter than it was twelve months ago.
For real estate investing success, you may need to work harder to source deals. That might mean:
- Developing relationships with wholesalers who could provide off-market opportunities
- Direct mail campaigns targeting distressed properties or motivated sellers
- Networking with estate attorneys, divorce lawyers, and other professionals who encounter distressed situations
- Using technology platforms that help aggregate real estate data like pre-foreclosure and auction listings
- Building a reputation in your target neighborhoods so homeowners think of you first
Some of the real estate investors thriving in tighter inventory environments are those who've built multiple deal pipelines rather than relying on a single source. Diversification in deal sourcing may become as important as diversification in your investment portfolio.
Trend #6: Adapting Your Flips for the Dominant Price Point
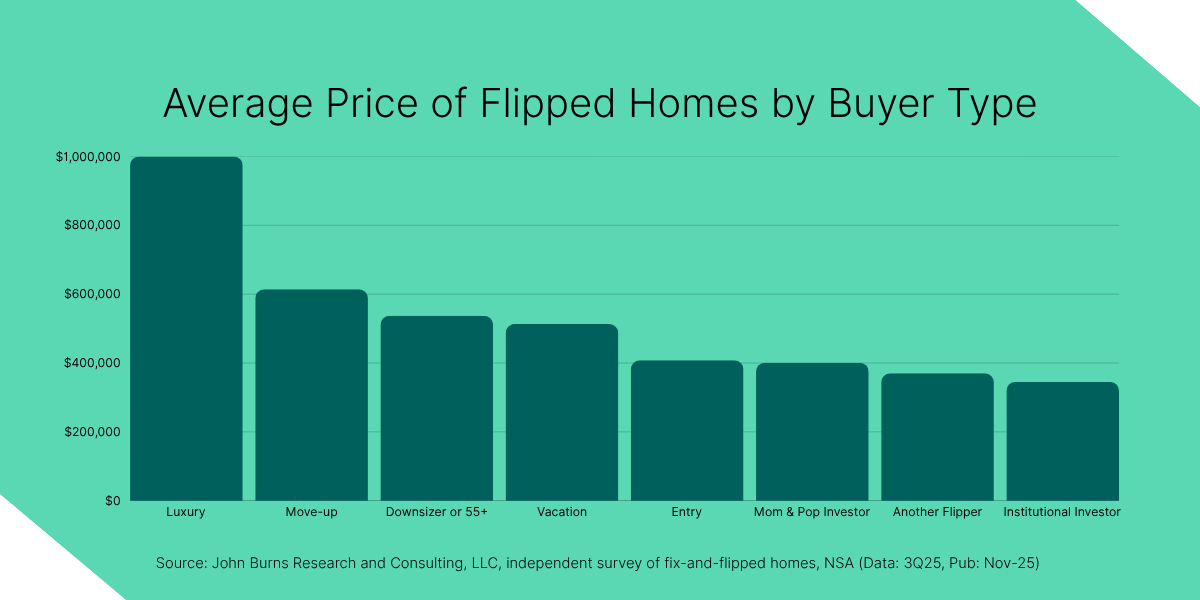
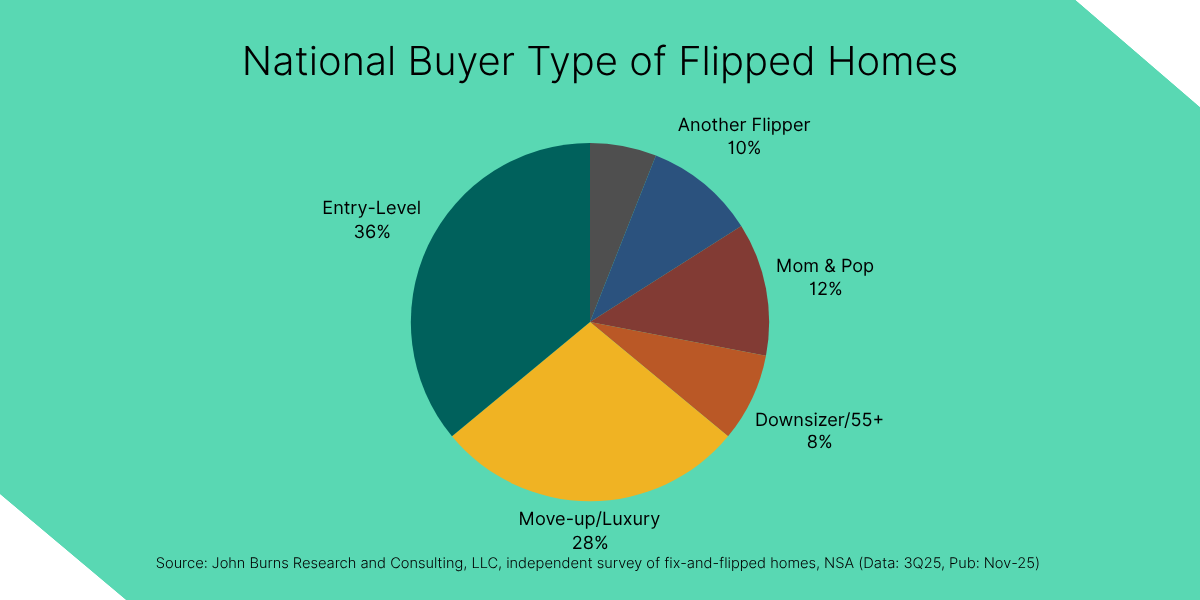
Understanding where transaction volume concentrates helps you position your projects for success. The JBREC + Kiavi survey reveals that 71% of flipped homes sold for under $500K. This is where the bulk of the market activity appears to be happening in Q3 2025.
Why does this matter? The survey shows that entry-level buyers, not luxury purchasers, drive most fix-and-flip sales, with 36% of flipped homes nationally going to this group in Q3 2025. Your renovation decisions should reflect this reality. While luxury finishes might be tempting, they may not generate proportional returns if they price out your most likely buyer.
Consider focusing your renovation efforts on:
- Quality improvements: Updated kitchens and bathrooms, fresh paint, modern flooring.
- Curb appeal: Improve the exterior to attract potential buyers.
- Functional layouts: Optimize the flow and use of space.
Here's another intriguing shift: Real estate investor purchases of flipped homes rose to 28% in 3Q25 from just 16% the previous year, according to the JBREC + Kiavi survey. That's a dramatic increase worth paying attention to.
What's driving this trend? Several possibilities exist:
- Turnkey rentals: REIs buying properties that are already renovated for immediate rental income.
- Portfolio diversification: Adding completed flips to a varied investment portfolio.
- Avoiding renovation risk: Purchasing finished flips in appreciating markets rather than taking on the renovation work themselves.
For you as a flipper, this could create an interesting secondary market. You're not just selling to retail homebuyers anymore—you're potentially selling to other REIs who evaluate deals differently. They may care more about cash flow potential and cap rates than emotional appeal. Understanding this buyer segment could open new exit strategies for your projects.
Your Strategy for Real Estate Investing in 2026
The JBREC + Kiavi 3Q25 survey data paints a picture of a fix-and-flip market that's adjusting to new realities. The slight FFMI contraction to 56, rising renovation costs hitting $80K, more cautious willingness to pay at 64% of ARV, and measured optimism among real estate investors all point to a market that's normalizing after the unusually strong conditions of previous years.
But here's what you should take away: normalization doesn't mean disaster. The survey data doesn't suggest a downturn so much as a shift in investment strategy. Successful real estate investing in 2026 may require:
- Meticulous deal analysis: With tighter margins, every number matters. Your acquisition price, renovation budget, holding costs, and exit strategy all may need careful scrutiny before you commit.
- Accurate budget forecasting: At $80K average renovation costs in Q3 2025, your contingency planning becomes important. Consider building realistic buffers and maintain relationships with reliable contractors who could provide accurate estimates.
- Understanding local market nuances: National averages tell part of the story, but your success might depend on understanding your specific market. Regional price variations, local buyer preferences, and neighborhood-level dynamics should drive your decisions.
- Multiple deal sources: With inventory availability tightening, you may need to diversify your pipelines for finding properties. The REIs who source deals most effectively could have the best selection of projects to choose from in 2026.
- Flexibility in exit strategies: With 28% of flipped homes now selling to REIs, consider who your buyers might be and how that could affect your renovation approach and pricing strategy.
Ready to move forward with your next fix-and-flip project? Explore Kiavi's fix-and-flip financing options to see how we can support your real estate investing goals with flexible, AI-powered, investor-friendly loan products designed for today's market conditions.
Kiavi Tip: The market has shifted meaningfully since Q3 2025. The Q1 2026 JBREC + Kiavi Fix and Flip Survey shows the FFMI recovering to 63, renovation costs easing to $79K, and ARV outcomes improving, with 21% of flippers now selling above their initial estimates versus 14% last quarter.
Source: John Burns Research and Consulting, LLC, independent survey of fix-and-flipped homes, NSA (Data: 3Q25, Pub: Nov-25)
%20(1).png)
Explore Related Content

JBREC + Kiavi Q1 2026 Fix and Flip Survey: What the Data Says About the Market Right Now
Editor's Note - Updated June 2026: This post has been updated to include a reference to..

Key Fix-and-Flip Insights From the JBREC + Kiavi Survey You Need to Know
Editor's Note - Updated May 2026: This post has been updated to reference the JBREC + Kiavi Q1..

Mid-Year Fix-and-Flip Market Check: Where Investors Are Winning in 2026
Not every fix-and-flip market is moving the same direction in 2026. Some states entered the..
You are leaving kiavi.com. Do you want to continue?