
Share
America's most historic cities are sitting on some of the largest concentrations of aging housing stock in the country, and in 2026 that supply gap may be working in favor of renovation-focused real estate investors. The median age of owner-occupied homes nationally climbed to 42 years in 2024, up from 31 years in 2005, per NAHB, and the oldest stock is heavily concentrated in Northeast and Southeast cities with historic preservation districts and deep architectural character. In these markets, the combination of constrained new supply, strong buyer demand for renovated homes, and entry prices well below the national median may create favorable conditions for fix-and-flip and rental investors who can execute on value-add acquisitions.
Why Historic Cities Are Worth a Second Look for Real Estate Investors
Historic cities tend to attract attention for their culture and tourism. For real estate investors, the case is more structural: older housing stock, architectural character that new construction typically cannot replicate, and buyer demographics that may skew toward households willing to pay a premium for authenticity and walkability. That profile maps directly onto what renovation-focused real estate investors could be positioned to deliver.
This post breaks down the market dynamics behind six historically significant U.S. cities, reviews the current data, and surfaces what investors considering fix-and-flip or rental acquisitions in these markets may want to know heading into the second half of 2026.
Why Does Aging Housing Stock Matter for Real Estate Investors?
America's housing stock is the oldest it has ever been, and that aging trend may be the most consequential structural dynamic for value-add real estate investors right now.
According to NAHB's March 2026 analysis, the median age of owner-occupied homes reached 42 years in 2024, up from 31 years in 2005. The share of homes at least 45 years old rose from 39% in 2014 to 47% in 2024. The share of homes built within the last 14 years has shrunk from 18% to just 13% over the same period.
That aging supply may not be distributed evenly. The oldest housing stock appears to be concentrated in legacy cities with deep pre-war building patterns: Northeastern and mid-Atlantic metros with Victorian-era rowhouses, Southeast markets with antebellum architecture, and Midwest cities built around early industrial activity. Historic cities, by definition, sit at the top of that concentration.
What does that mean for real estate investors?
- Renovation supply may be expanding. The April 2026 Housing Monitor estimates that more than half of current resale listings are over 20 years old, with roughly one-third requiring repairs. Sellers are increasingly choosing to list homes as-is rather than invest in pre-sale renovation, which may widen the acquisition pool for real estate investors who can execute rehab work efficiently.
- Buyer demand for renovated product appears to be strong. The same buyers being priced out of new construction may be gravitating toward renovated historic homes with updated mechanicals and preserved architectural character. That demand dynamic could support after-repair value (ARV) in well-executed projects.
- Remodeling activity could be structurally growing. NAHB reported in February 2026 that residential remodeling is estimated to increase 3% in 2026, with total remodeling expenditures projected to be 19% higher by 2030 and 32% higher by 2035.
Kiavi Tip: Aging housing stock typically means deferred maintenance that buyers may not see but inspectors could flag. Budgeting for mechanical upgrades (HVAC, electrical, plumbing) alongside cosmetic renovation may improve your post-renovation pricing position in historic districts.
Six Historic Cities Real Estate Investors Are Watching in 2026
The following cities share common traits worth noting:
- Recognized historic character
- Strong non-investor demand (tourism, healthcare, education)
- Entry prices at or below the national median in most cases
- Meaningful aging housing inventory
They also could carry individual risk profiles that real estate investors should assess at the deal level.

Philadelphia, Pennsylvania
Philadelphia's investment case starts with price. At a median sale price of $290,000 through May 2026 (up 3.5% year-over-year, per Redfin), Philly may offer access to one of the largest historic urban cores in the country at a significant discount to other major East Coast metros. The national median hit $398,771 in May 2026, also per Redfin, making Philadelphia roughly 37% below the U.S. average.
The city's architectural density could matter more for fix-and-flip investors specifically. Philadelphia has one of the largest concentrations of pre-1940 rowhouse stock in the United States, providing a potentially consistent pipeline of value-add acquisition targets in neighborhoods undergoing revitalization.
|
Philadelphia Submarket |
Median Listing Price |
Investor Strategy |
Potential Considerations |
|
Fishtown |
~$424,900 |
Luxury flip, short-term rental |
Arts district demand, high walkability, premiums for renovated product |
|
Point Breeze |
$300K-$400K |
Value-add fix and flip |
Active in-migration from priced-out buyers |
|
Brewerytown |
$300K-$400K |
Value-add fix and flip |
Young buyer demand, proximity to Fairmount Park |
|
West Philadelphia |
$200K-$300K |
Revitalization play |
Projected 2.5-4.5% appreciation corridor over next 12 months |
|
Port Richmond |
$200K-$300K |
Affordable entry, full rehab |
Industrial neighborhood with growing residential demand |
Source: Local Philadelphia market data, Q1-Q2 2026
Philadelphia's proximity to New York City and Washington, D.C. may continue to support migration-driven demand, as buyers unable to afford coastal metro prices increasingly look inward.
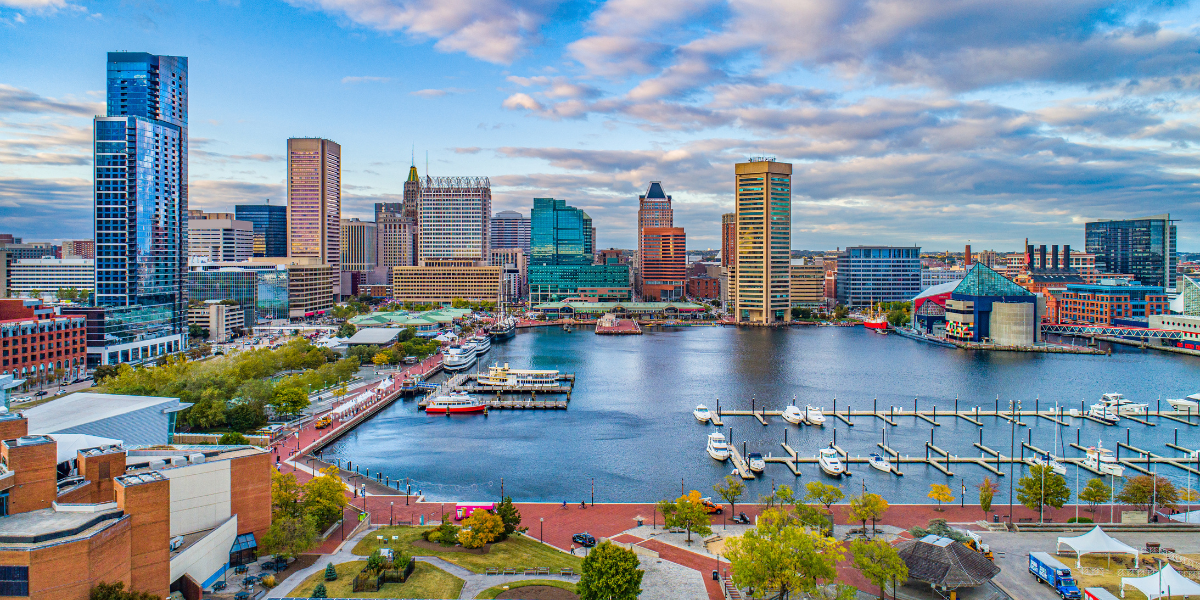
Baltimore, Maryland
Baltimore produced a median sale price of $245,000 through May 2026, up 2.9% year-over-year, per Redfin, making it one of the most affordable major East Coast markets. At 44% below the national median, Baltimore may offer some of the highest ARV spread potential of any metro in this group for real estate investors who can identify the right neighborhood.
The city's investment thesis is neighborhood-specific, with established renovation markets on one end and emerging corridors on the other.
|
Baltimore Submarket |
Median Price Range |
Investor Strategy |
Potential Considerations |
|
Federal Hill |
$300K-$450K |
Cosmetic flip, short-term rental |
Established market, strong buyer competition for renovated homes |
|
Canton |
$300K-$425K |
Cosmetic flip, rental hold |
Waterfront proximity, potentially consistent tenant demand |
|
Fells Point |
$280K-$400K |
Luxury rehab, short-term rental |
Historic district designation, tourism-driven STR demand |
|
Hampden |
$250K-$350K |
Value-add flip |
Artsy neighborhood, younger buyer demographic |
|
Remington |
$180K-$280K |
Full rehab, BRRRR |
Emerging corridor, lower entry, improving demand |
|
Station North |
$150K-$260K |
Full rehab, rental hold |
Arts district, Johns Hopkins proximity, higher execution risk |
Source: Local Baltimore market data, Q1-Q2 2026
Baltimore's healthcare and education anchors (Johns Hopkins, UMMS, University of Maryland) may provide a stable employment base that could support consistent rental demand across submarkets. The city's designation as a ULI Markets to Watch candidate may also reflect broader institutional awareness that low-entry, high-character East Coast markets might offer stronger fundamentals than many Sun Belt metros in the current cycle.

Savannah, Georgia
Savannah might occupy an unusual position in 2026. Its housing market may have moderated after several years of rapid appreciation: Redfin data shows home prices down 3.1% year-over-year through May 2026, with a median of $339,000. Homes are spending more time on market (82 days in May versus 57 days a year earlier).
For acquisition-focused real estate investors, that moderation may translate into better entry pricing and more negotiating leverage than Savannah offered during its peak. The city's structural demand drivers may remain intact: strong port logistics activity, a growing tourism economy, and one of the most visited historic districts in the Southeast that could produce consistent short-term rental demand.
The Savannah–Hilton Head metro ranked among the top emerging multifamily markets in 2026, per Yardi Matrix / Multi-Housing News, with investment volume of $436 million and the highest delivery intensity among emerging markets at 8.7% of stock. That new supply may compete with renovated historic products in the short-term rental market, which real estate investors should consider underwriting carefully.
Fix-and-flip investors in Savannah typically face the challenge of updating older housing stock within preservation constraints that may add cost. Thorough scope-of-work planning and an understanding of which properties fall under local historic district requirements may be more important in Savannah than in markets without those overlays.
Kiavi Tip: In markets with historic district overlays, renovation timelines may run longer due to required approvals. Building that timeline into your bridge loan draw schedule upfront could reduce carry cost pressure during the renovation phase.
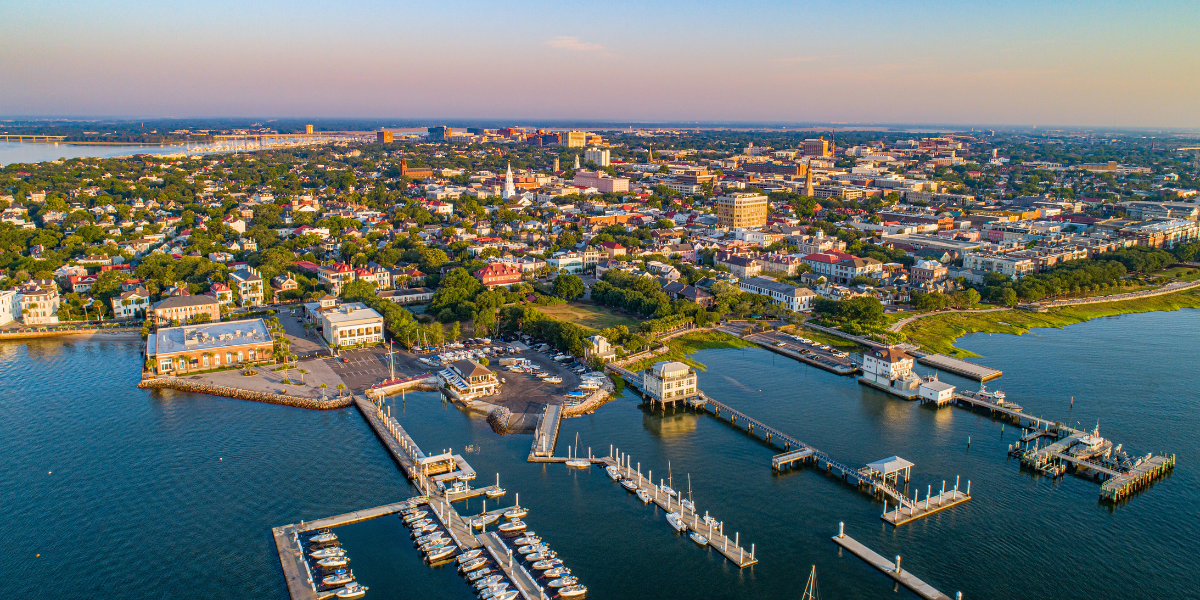
Charleston, South Carolina
Charleston's metro median home price has risen from $301,000 in 2020 to approximately $425,000 in 2025, with economists projecting 2-3% appreciation in 2026, per local market data. That appreciation may reflect a market that has seasoned significantly from its pandemic peak, which might favor real estate investors who had difficulty competing during that period.
Roughly 44% of Charleston households are renter-occupied, potentially providing durable rental demand. Average metro rents sit around $2,037/month as of early 2026, with downtown Charleston commanding approximately $4,100/month, which may create strong ARV support for well-executed downtown renovations.
Charleston's economic base may also have strengthened with Boeing expanding via a $1 billion investment (approximately 1,000 new jobs), a $3.5 billion Redwood Materials battery plant, and continued Volvo manufacturing operations. That diversification may support long-term employment stability and housing demand.
|
Charleston Submarket |
Median Price Range |
Investor Strategy |
Potential Considerations |
|
North Charleston |
$200K-$350K |
Value-add fix and flip |
Potentially high first-time buyer demand, lower entry |
|
West Ashley |
$350K-$450K |
Renovation flip or BRRRR |
Priced-out downtown buyers may be migrating here |
|
James Island |
$400K-$500K |
Cosmetic flip |
Coastal lifestyle demand may support ARV |
|
Summerville |
$250K-$350K |
Affordable entry, extensive rehab |
Further from core but strong appreciation trend |
Source: Local Charleston market data, April 2026
Kiavi Tip: The short-term rental market in Charleston appears strong by many benchmarks. AirDNA rates Charleston with a Market Score of 91/100 and an investability score of 79/100, reflecting potentially favorable demand-to-supply dynamics for vacation rental operators.

New Orleans, Louisiana
New Orleans could be the most complex market in this group. Home prices remain well below the national median (average values sit in approximately the $225,000-$250,000 range in 2026), and the city's architectural stock is arguably one of the most irreplaceable in North America. For real estate investors who can operate in it effectively, New Orleans may offer compelling value.
The deal-level case for New Orleans may depend heavily on submarket and property type. Creole cottages and shotgun houses in neighborhoods with established buyer demand could produce meaningful ARV spreads from well-executed renovations. Real estate investors should evaluate each neighborhood carefully on its own fundamentals.
|
New Orleans Submarket |
Typical Entry Range |
Investor Strategy |
Potential Considerations |
|
Mid-City |
$180K-$320K |
Value-add fix and flip, rental hold |
Strong buyer demand, walkable, lower insurance risk than lakefront areas |
|
Uptown |
$250K-$500K |
Renovation flip, luxury rental |
Premium buyer market, architectural character commands ARV premiums |
|
Bayou St. John |
$280K-$450K |
Cosmetic to mid-range flip |
Desirable location, competitive acquisition environment |
|
Gentilly |
$130K-$230K |
Full rehab, rental hold |
Potentially more affordable entry, improving demand, flood zone review required |
|
Algiers Point |
$150K-$260K |
Full rehab, fix and flip |
Historic character, river views, lower competition than upriver neighborhoods |
Source: Local New Orleans market data, Q1-Q2 2026
The challenges are real and investor-specific. Insurance costs may have increased substantially across the Gulf Coast region, and New Orleans carries elevated flood and wind risk that should be factored into acquisition underwriting. Renovation costs in the French Quarter and adjacent historic neighborhoods may run higher than comparable markets due to permitting, material requirements, and labor constraints tied to historic preservation.
Real estate investors with Gulf Coast renovation experience and established contractor networks may find New Orleans conditions more favorable than investors newer to the market. Securing accurate insurance quotes before finalizing your acquisition price may be a non-negotiable step in this market, where that cost has been volatile and could materially compress margins.

Washington, D.C.
Washington, D.C. is the highest-priced market in this group and arguably one of the most operationally complex. The median sale price in DC hit $695,000 through May 2026, down 0.77% year-over-year, per Redfin. That places it well above the national median and above every other city in this post. The investment thesis here is neighborhood-specific and strategy-specific to a degree that may exceed any other market on this list.
For fix-and-flip investors, the strongest margins may be concentrated in transitional east-of-the-river corridors, where entry prices could run significantly below the city median and large-scale infrastructure projects may support future appreciation. For rental investors, the case is anchored by some of the most durable fundamentals in any major U.S. city: vacancy rates below 3.5% citywide, average rents around $2,500 per month, and a federal employment base that has historically insulated the market from cyclical demand swings.
One genuine risk to underwrite in 2026 may be federal workforce uncertainty. DC's seasonally adjusted unemployment rate reached 6.3% as of March 2026, one of the highest in the nation. That uncertainty may have softened buyer demand and increased inventory, with active sellers outnumbering buyers by roughly 20% in the metro area as of April 2026, per local MLS data. For real estate investors with longer hold timelines and execution capacity, that softening may create acquisition opportunities. For real estate investors dependent on a quick resale, DC's current market may require more conservative ARV assumptions and carry cost buffers than it did in prior years.
|
Washington, D.C. Submarket |
Typical Entry Range |
Investor Strategy |
Potential Considerations |
|
Capitol Hill |
$700K-$1M+ |
Luxury rental hold, cosmetic flip |
Vacancy below 3%, stable appreciation, premium tenant demand |
|
Columbia Heights |
$500K-$750K |
Value-add rental, mid-range flip |
Strong transit access, diverse renter base, consistent absorption |
|
Petworth |
$500K-$650K |
BRRRR, rental hold |
Lower entry vs. Capitol Hill, family-friendly, Metro-accessible |
|
Shaw / U Street |
$600K-$900K |
Luxury flip, short-term rental |
Rapid revitalization, young professional demand, competitive acquisition |
|
Anacostia / Congress Heights |
$250K-$450K |
Full rehab fix and flip |
Lowest DC entry prices, transitional market, higher execution risk |
|
Brookland |
$450K-$600K |
Rental hold, value-add flip |
University-anchored demand, arts district, below-average vacancy |
Source: Local Washington, D.C. market data, Q1-Q2 2026
DC's signature rowhouse stock, typically three to four bedrooms with English basement conversion potential, may generate stronger cash flow per unit than the headline median suggests. Real estate investors pursuing basement conversions to add a rentable unit could improve debt service coverage meaningfully on properties that might otherwise appear cash-flow negative at DC price points.
Kiavi Tip: DC's Tenant Opportunity to Purchase Act (TOPA) requires landlords to offer tenants the right to purchase before selling certain properties. Real estate investors acquiring occupied properties in DC should consider factoring TOPA timelines into their deal structure and bridge loan term before closing.
How to Evaluate a Historic City Deal: A Decision Framework
Not every historic city deal is the same. Preservation overlay, entry price, renovation cost, buyer demographics, and local regulatory environment all could vary across the six markets covered here. Consider using this framework to assess fit before committing capital:
If the property is in a historic preservation district:
- Renovation scope likely requires local review board approval. Budget 4-8 additional weeks and potentially 10-15% higher renovation costs for materials that meet preservation standards.
- ARV in designated districts may be supported by strong buyer premiums for authentic architectural character, which could offset higher renovation cost.
If entry price is below $200,000:
- High ARV upside may be possible in markets like Baltimore and Philadelphia, but renovation scope typically touches structural and mechanical systems, not just cosmetic. Consider budgeting for full scope discovery before finalizing your deal.
If the market is moderated (Savannah, parts of Charleston, DC in 2026):
- Longer days on market may allow negotiation. Sellers who priced for peak conditions may be more motivated today.
- Longer days on market could also mean extended carry for your bridge loan if the finished product does not appraise or sell quickly. Conservative ARV underwriting may be especially important.
If entry price is at or above the national median (Washington, D.C.):
- Carry cost and exit timing may become more consequential at higher price points. Consider budgeting a minimum of 3-4 months of holding costs and underwrite ARV conservatively.
- Basement conversion or unit-add strategies may improve cash flow and DSCR qualification on properties that appear cash-flow negative at face value.
If rental strategy is primary (DSCR hold):
- Consider evaluating submarket vacancy rates, not just metro-level averages. Historic neighborhoods may often outperform metro-level DSCR metrics due to above-average tenant retention.
- Factor city-specific rental regulations, especially for short-term rentals in New Orleans and Charleston, and TOPA tenant purchase rights in Washington, D.C., which may have active permitting and procedural requirements.
For a broader look at how bridge financing fits into acquisition-to-rental strategies, the refinancing roadmap for real estate investors may be worth reviewing alongside your historic market deal analysis.
What Should Real Estate Investors Know About Financing Historic Renovations?
Bridge loans are one of the most common financing tools for historic city fix-and-flip projects, and for good reason: the acquisition-plus-renovation capital structure fits how these deals work. Real estate investors acquire at a discount, fund renovation draws as work is completed, then either sell the renovated property or refinance into a DSCR loan for long-term hold.
A few financing mechanics matter more in historic markets than in newer housing:
Draw schedules may need to accommodate inspection delays. In markets where historic district reviews are required at the permit stage, renovation milestones may take longer to reach. Lenders who manage draws digitally, like Kiavi, and allow flexible milestone scheduling may reduce friction on longer-timeline projects.
Contingency reserves are often necessary. Older homes in historic cities may frequently contain deferred maintenance that only becomes visible after demo. Bridge loans that accommodate budget revisions or have a mechanism for contingency draws may reduce the risk of mid-project capital shortfalls.
ARV appraisals require comparable renovation data. In historic districts with limited recent comparable sales, appraisers may lean on a smaller comp pool. Real estate investors who can document buyer demand for renovated products in their target neighborhood may have stronger appraisal outcomes.
Kiavi Tip: For investors evaluating their loan options, Kiavi's bridge loan program is built specifically for the acquisition-to-renovation workflow that historic city fix and flip deals require.
Final Thoughts
America's historic cities could be producing a real opportunity in 2026, built on structural factors that may have been building for years: an aging national housing stock, buyer demand for renovated architectural character, and entry prices that remain below the national median in markets like Baltimore and Philadelphia. That combination tends to favor real estate investors who can execute renovation efficiently and underwrite deals conservatively.
The cities covered here range from high-entry, strong-fundamentals markets (Washington, D.C., Charleston) to more affordable value-add environments (Philadelphia, Baltimore) to markets that may be in active recalibration (Savannah) to high-character, complex environments (New Orleans). The right fit often depends on your experience, contractor network, and capital structure. Real estate investors ready to explore bridge financing for their next historic acquisition can price out a deal online in minutes with Kiavi.
Sources
- Washington, D.C. Housing Market: House Prices and Trends, Redfin, May 2026
- How Old Is Today's Housing Stock, NAHB, March 2026
- Why Aging Housing Stock Is Creating a Long-Term Renovation Opportunity, Anchor Loans Housing Monitor, April 2026
- Philadelphia Housing Market: House Prices and Trends, Redfin, May 2026
- Baltimore Housing Market: House Prices and Trends, Redfin, May 2026
- Savannah Housing Market: House Prices and Trends, Redfin, May 2026
- United States Housing Market and Prices, Redfin, May 2026
- Top 10 Emerging Multifamily Markets of 2026, Multi-Housing News / Yardi Matrix, April 2026
- 2026 Housing Outlook: Ongoing Challenges, Cautious Optimism and Incremental Gains, NAHB, February 2026
- NAHB Expects Remodeling Growth in 2026 and Beyond, NAHB, February 2026
- Best Areas to Invest in Charleston, SC for Purchasing a Home, Southern Belle Living, April 2026
- Charleston, SC Rental Market Trends, Rent Cafe, June 2026
%20(1).png)
You are leaving kiavi.com. Do you want to continue?