
Share
Editor's Note - Updated June 2026: This post has been updated to include a reference to Fix-and-Flip Scope of Work: What Lenders Look For. If rising renovation costs and tighter margins are affecting your deal underwriting, understanding what lenders look for in a scope of work may help you submit stronger, faster applications. Read it here
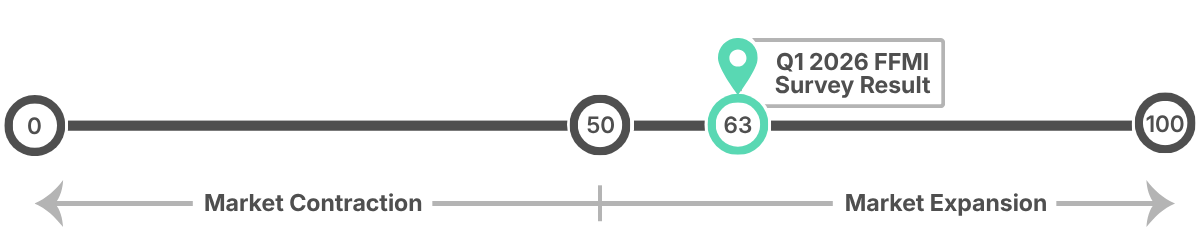
The Burns + Kiavi Fix and Flip Housing Market Index (FFMI)TM rose to 63 out of 100 in Q1 2026, up from 62 in Q4 2025, according to the John Burns Research & Consulting + Kiavi Fix and Flip Survey. Average renovation costs climbed to $79K per project in Q1 2026, up from $50K in early 2022, and 47% of flippers say they plan to keep more rentals in 2026 than they did in 2025, the highest share in the survey's four-year history.
Key Takeaways
- The Burns + Kiavi FFMITM rose to 63 in Q1 2026, up 5 points year-over-year.
- Average renovation costs may now reach $79K per flipped home, up from $75K in Q4 2025.
- According to the survey, 47% of flippers plan to keep more homes as rentals in 2026, the highest share in four survey years.
- Large flippers (8+ transactions in 18 months) tend to report stronger pricing and sales than smaller operators.
- 30% of flippers cite economic uncertainty as the biggest risk to their business over the next 12 months.
What the Q1 2026 Fix and Flip Survey May Reveal About the Market Right Now
Each quarter, Kiavi partners with John Burns Research and Consulting (JBREC) to survey active fix-and-flip real estate investors across the country. The Q1 2026 results are now in. According to the survey, renovation costs reached $79K per project, a record 47% of flippers plan to keep more homes as rentals, and economic uncertainty ranked as the top risk to flipping businesses for the next 12 months.
Here's what the numbers show, and what they could mean for your next deal.
What Is the Burns + Kiavi Fix and Flip Market Index, and How Does It Work?
The FFMITM is designed to measure how fix-and-flip market conditions compare to seasonal norms. It is not an absolute measure of activity level; it is a directional signal. A score above 50 means conditions are expanding relative to expectations, and a score below 50 means conditions are contracting.
The index combines three subindices, each scored on a 0-to-100 scale:
|
Subindex |
What It Measures |
Q1 2026 Score |
|
Current Flipped Home Sales |
How current sales compare to seasonal expectations |
62 |
|
Expected Sales (6 Months) |
How flippers expect sales to perform in the next 6 months |
66 |
|
Availability of Pre-Flip Homes |
Competition for deals relative to seasonal norms |
64 |
Source: John Burns Research and Consulting, LLC, independent survey of fix-and-flipped homes, NSA (Data: 1Q26, Pub: May-26)
All three subindices came in above 50 in Q1 2026, producing an overall FFMITM of 63. For context, the index reached 58 one year ago in Q1 2025 and touched a low of 50 in Q4 2022 during the post-pandemic correction. The current reading of 63 represents the highest level since Q4 2023.
Kiavi Tip: Understanding where the FFMITM stands relative to prior quarters could help you calibrate deal selection. When current sales and expected sales both score above 60, buyers tend to be more active, which may support ARV assumptions in well-located markets. You can see the JBREC + Kiavi Fix and Flip Q4 2025 data here.
How Do Current Sales and Near-Term Expectations Look for Flippers?
The Current Flipped Home Sales subindex rose to 62 in Q1 2026, its highest level since Q2 2024. That improvement reflects a real shift: 37% of flippers nationally reported good current sales relative to seasonal norms, up from 34% in Q4 2025 and 31% one year ago.
That said, conditions vary significantly by region. According to the JBREC survey, Florida and Texas are the weakest markets for flipped home sales, driven by competition from elevated new construction and resale supply. Northeast and Southwest flippers report the tightest conditions for available inventory, which tends to keep pricing more stable but makes deal sourcing harder.
Regional current sales breakdown (Q1 2026, per JBREC):
|
Region |
% Rating Sales "Good" |
|
Northeast |
50% |
|
Southwest |
44% |
|
Midwest |
39% |
|
Northern California |
44% |
|
National |
37% |
|
Texas |
38% |
|
Florida |
25% |
Source: John Burns Research and Consulting, LLC, independent survey of fix-and-flipped homes, NSA (Data: 1Q26, Pub: May-26)
On the forward-looking side, the Expected Sales subindex held at 66 in Q1 2026. Per the JBREC survey, 44% of flippers nationally expect good sales activity over the next six months, the highest share since Q1 2024. The Northeast and Southeast are the most optimistic regions; Florida and Texas flippers remain the least confident about near-term performance.
How Does Flipper Size Affect Market Performance?
One of the most revealing additions to the Q1 2026 JBREC + Kiavi fix and flip survey is a breakdown by flipper size. Large flippers, defined as operators who bought or sold eight or more homes in the past 18 months, consistently outperform smaller operators on both pricing and sales.
According to JBREC, the net share of large flippers rating current sales as good was 81% in Q1 2026, compared to 29% for small flippers. On pricing, large flippers reported a net +43% rate of selling above initial ARV estimates, while small flippers came in at just +2%.
"The investors putting up strong numbers right now tend to share a few things: tighter cost estimates, more realistic exit pricing, and contractor relationships they've built over time. What's encouraging is that none of that is out of reach for newer investors. The discipline is learnable. The gap closes faster than most people expect when you're honest about your numbers from the start."
— Charles Goodwin, Head of Bridge and DSCR Lending, Kiavi
For smaller and mid-volume flippers, this data could point to where operational improvements tend to pay off: deal selection discipline, renovation cost accuracy, and exit pricing realism.
Kiavi Tip: If you're working toward higher volume, a bridge loan for fix-and-flip investing could provide the speed and certainty of close that larger deal counts often require.
What Are Average Renovation Costs in Q1 2026?
Renovation costs remain one of the clearest financial pressures in the fix-and-flip market. According to the Q1 2026 JBREC + Kiavi Fix and Flip Survey, the national average renovation cost per flipped home reached $79K in Q1 2026, up slightly from $75K in Q4 2025 and from approximately $50K in early 2022. That represents more than a 50% increase in just over four years.
Renovation costs as a share of the flipped home sales price held at 16% nationally in Q1 2026, flat from the prior year. However, regional variation is substantial:
|
Region |
Avg. Renovation Cost |
Reno as % of Sales Price |
|
Northern California |
$149K |
17% |
|
Southern California |
$121K |
14% |
|
Northeast |
$99K |
17% |
|
Southwest |
$87K |
13% |
|
Northwest |
$81K |
15% |
|
National |
$79K |
16% |
|
Florida |
$72K |
15% |
|
Texas |
$57K |
17% |
|
Midwest |
$56K |
21% |
|
Southeast |
$51K |
17% |
Source: John Burns Research and Consulting, LLC, independent survey of fix-and-flipped homes, NSA (Data: 1Q26, Pub: May-26)
According to the survey, the Midwest carries the highest renovation-cost-to-price ratio at 21%, reflecting both lower average sale prices and older housing stock that typically requires more extensive work. Northern California had the highest absolute renovation costs, but those costs could be more readily absorbed in a market where average flipped home sale prices may reach $880K.
For investors navigating tighter per-project margins, how the scope of work is structured before approaching a lender could affect both the loan amount and the draw schedule. A well-organized SOW that reflects accurate, itemized trade costs may reduce underwriting friction on future deals. Investors looking to strengthen their lender submissions can reference what a lender-ready fix-and-flip SOW typically includes.
How Are Flippers Approaching ARV in the Current Market?
After-repair value accuracy may be one of the most important variables in fix-and-flip performance right now. Per the Q1 2026 JBREC + Kiavi Fix and Flip Survey, 37% of flippers nationally are willing to pay 60% or less of ARV when acquiring an investment property to flip. The national weighted average sits at 67% of ARV, down slightly from a year ago.
The direction of ARV willingness could be a useful signal. A declining willingness-to-pay percentage typically signals less confidence in near-term price appreciation. An increasing percentage may signal relative optimism.
Regional breakdown for Q1 2026 according to the survey:
|
Region |
Max ARV % Willing to Pay (Q1 2026) |
YOY Direction |
|
Southwest |
71% |
↑ Up |
|
Midwest |
70% |
↑ Up |
|
Florida |
70% |
↑ Up |
|
Southern California |
69% |
↓ Down |
|
Northern California |
68% |
→ Flat |
|
National |
67% |
↓ Down |
|
Texas |
67% |
→ Flat |
|
Northeast |
66% |
↓ Down |
|
Southeast |
66% |
↓ Down |
|
Northwest |
61% |
↓ Down |
Source: John Burns Research and Consulting, LLC, independent survey of fix-and-flipped homes, NSA (Data: 1Q26, Pub: May-26)
On the sell side, the Q1 2026 survey results show some potential improvement in how flipped homes performed against initial ARV estimates:
|
ARV Outcome |
Q1 2026 |
Q4 2025 |
|
Sold mostly above initial ARV |
21% |
14% |
|
Sold mostly in line with ARV |
62% |
69% |
|
Sold mostly below ARV |
17% |
17% |
Source: John Burns Research and Consulting, LLC, independent survey of fix-and-flipped homes, NSA (Data: 1Q26, Pub: May-26)
Interestingly, when flippers in Q1 2026 did sell below ARV, all of the survey respondents attributed it to overestimating the final sales price. Of that group, 58% also underestimated renovation costs. This could be one of the most reliable failure patterns in the data: price overestimation and cost underestimation tend to compound each other. Both are correctable with tighter market comping and more conservative renovation bids before you go under contract.
For a deeper look at how ARV fits into deal analysis, the ARV estimator tool on kiavi.com may help you pressure-test your assumptions before committing.
What Types of Buyers Are Purchasing Flipped Homes?
Entry-level buyers continue to dominate the flipped home buyer mix. According to the survey, entry-level buyers accounted for 48% of flipped home purchases nationally in Q1 2026, down slightly from 53% last quarter but still the majority.
This concentration in the entry-level segment may have implications for deal selection. The table below shows how average sale prices and renovation costs vary significantly by buyer type according to the survey.
|
Buyer Type |
Avg. Sale Price |
Avg. Renovation Cost |
|
Luxury |
$1.0M |
$166K |
|
Vacation/Second Home |
$851K |
$137K |
|
Move-Up |
$577K |
$95K |
|
Downsizer/55+ |
$438K |
$75K |
|
Entry-Level |
$444K |
$73K |
|
Mom & Pop Investor |
$291K |
$57K |
|
Institutional Investor |
$256K |
$30K |
|
Another Flipper |
$249K |
$10K |
Source: John Burns Research and Consulting, LLC, independent survey of fix-and-flipped homes, NSA (Data: 1Q26, Pub: May-26)
Investor buyers, including institutional buyers and other flippers, may purchase partially renovated homes and complete the remaining work themselves, which could account for their significantly lower average renovation costs. For flippers targeting entry-level buyers, renovation budgets around $73K tend to be the norm, according to the survey, while luxury and vacation home projects may require considerably more investment to meet buyer expectations.
The entry-level market concentration also reflects affordability constraints that may continue to weigh on buyer demand. Per the survey, overall flipped home transactions fell to approximately 36K in Q1 2026, the lowest level since Q1 2015, and declined 9% year-over-year across 103 metros surveyed.
Why Are More Flippers Holding Properties as Rentals?
The most strategically significant finding in the Q1 2026 survey may be the rental pivot. According to the survey, 47% of surveyed flippers say they plan to keep more homes as rentals in 2026 than they did in 2025. That is the highest share recorded in the four-year history of the survey.
The regional breakdown could reveal where this shift is most pronounced:
|
Region |
% Planning to Keep More as Rentals |
|
Texas |
67% |
|
Southeast |
54% |
|
Florida |
54% |
|
Northern California |
50% |
|
National |
47% |
|
Midwest |
44% |
|
Southern California |
40% |
|
Northeast |
24% |
Source: John Burns Research and Consulting, LLC, independent survey of fix-and-flipped homes, NSA (Data: 1Q26, Pub: May-26)
Texas leads by a wide margin, with two-thirds of flippers planning to hold more homes. Per JBREC's analysis, this could reflect an effort to avoid selling in markets where home prices are declining, particularly in metros like San Antonio and Austin where flippers report elevated inventory and softening values. According to the survey, flippers in some Southeast markets noted that lower DSCR rates may make holding a property more attractive than selling it at current prices.
"The data reflects what I hear from investors regularly. Selling isn't always the right exit. If the numbers on a rental make sense after the renovation, refinancing into a DSCR loan can turn a short-term project into a long-term income-producing asset. That flexibility is worth building into your deal analysis before you even go under contract."
— Charles Goodwin, Head of Bridge and DSCR Lending, Kiavi
For real estate investors considering a buy and hold strategy on completed projects, a DSCR rental loan may offer a financing path to refinance out of a bridge loan and hold the asset for cash flow. Understanding the DSCR loan qualification process before you close the flip could shape how you structure the deal from the start. For a comprehensive look at how this strategy connects to the BRRRR method, Kiavi's guide to the BRRRR strategy for rental property growth walks through the full cycle.
What Are Flippers' Near-Term Pricing Expectations?
According to the Q1 2026 JBREC + Kiavi Fix and Flip Survey, real estate investors are cautious about near-term price appreciation. The national average expected price change for flipped homes over the next six months came in at just +0.7% in Q1 2026, down from +2.0% a year ago and +3.0% two years ago.
The regional picture varies considerably:
- Southern California flippers expect the strongest near-term appreciation at approximately +5%
- Texas, Northern California, and Southeast flippers expect slight declines of -1% on average
- Most regions expect prices to remain relatively flat
Per the survey, the majority of flippers in every region expect flipped home prices to remain flat over the next six months, though more expect increases than decreases in every region except Texas and the Southwest.
What Are the Biggest Risks Flippers Are Watching Right Now?
This quarter's survey asked flippers directly about what they believe the biggest risks to their flipping business over the next 12 months may be. The results are notable because the top risk is not financing costs or renovation inflation. It appears to be uncertainty.
Here is how surveyed real estate investors ranked their top risks nationally:
|
Risk Factor |
Share of Flippers Citing as Biggest Risk |
|
Weak demand due to economic uncertainty/recession |
30% |
|
Limited inventory / too much competition |
20% |
|
Rising renovation costs |
17% |
|
Weak demand due to poor affordability |
11% |
|
Declining home prices |
11% |
|
High financing costs for projects |
11% |
Source: John Burns Research and Consulting, LLC, independent survey of fix-and-flipped homes, NSA (Data: 1Q26, Pub: May-26)
Flippers from Dayton, Ohio to Los Angeles cited geopolitical uncertainty as a potential drag on buyer confidence. Regional risk rankings appear to diverge sharply. Southwest flippers (33%) and Texas flippers (32%) rank declining home prices as their primary concern. Northwest flippers (40%) are most worried about limited inventory and competition for deals.
Worth noting: financing costs, often the default concern for leveraged real estate investors, ranked last on the national risk list in the Q1 2026 survey. For investors who have been waiting on the sidelines, the data suggests the barriers may be more psychological than structural right now, and that tends to be where opportunity opens up for disciplined operators.
Final Thoughts
The Q1 2026 JBREC + Kiavi Fix and Flip Survey appears to tell a straightforward story: conditions are expanding, sentiment has improved year-over-year, and a growing share of real estate investors are beating their initial ARV estimates.
Renovation costs and economic uncertainty are real factors to plan around, but per the survey, flippers who go in with disciplined numbers and a clear exit strategy tend to find opportunity in exactly this kind of environment.
If you're ready to run the numbers on your next deal, price out a bridge loan for fix-and-flip investing at kiavi.com.
Additional Resources
%20(1).png)
Explore Related Content

Mid-Year Fix-and-Flip Market Check: Where Investors Are Winning in 2026
Not every fix-and-flip market is moving the same direction in 2026. Some states entered the..

Is the Market Turning? JBREC + Kiavi Q4 2025 Fix-and-Flip Survey Insights
Editor's Note - Updated May 2026: This post has been updated to reference the JBREC + Kiavi Q1..

The 7 Best Fix-and-Flip Markets for 2026
Editor's Note - Updated May 2026: This post has been updated to reference the JBREC + Kiavi Q1..
You are leaving kiavi.com. Do you want to continue?