
Share
The U.S. housing market entered the second half of 2026 with home prices at a record high and the strongest sales pace since 2022. Foreclosure filings rose 21% in the first half of the year, which may keep widening the pool of distressed inventory for real estate investors who source those deals. Apartment supply fell below its decade norm for the first time in three years, a shift that could support rental fundamentals in lower-supply markets over time.
Where Is Distressed Deal Flow Building at Mid-Year 2026?
227,548 properties had a foreclosure filing in the first half of 2026, up 21% year-over-year. Starts rose 18% and REOs rose 33%.
Foreclosure filings continued their gradual annual climb through mid-year, reaching 227,548 properties in the first six months of 2026, up 21% from the same period in 2025 and up 28% from the first half of 2024, according to ATTOM's Mid-Year 2026 U.S. Foreclosure Market Report.
Foreclosure starts, which tend to be one of the leading indicators of future distressed supply, climbed 18%, while completed foreclosures (REOs) rose 33%. For real estate investors who run distressed acquisition strategies, the growth in starts may point to more pre-foreclosure inventory over the coming quarters.
On a monthly basis, activity appeared to ease from the spring. Foreclosure starts came in at 26,217 in June, down 4% from May but up 20% year-over-year, and lenders repossessed 4,773 properties, up 17% for the month and up 23% annually, per ATTOM.
|
Metric |
First Half 2026 |
YOY Change |
|
Total foreclosure filings |
227,548 |
+21% |
|
Foreclosure starts |
164,566 |
+18% |
|
Bank repossessions (REOs) |
27,983 |
+33% |
|
Avg. days to complete (Q2) |
563 days |
-13% |
Source: ATTOM, July 2026
One timing detail may matter for property sourcing: the average foreclosure took 563 days to complete in the second quarter, the shortest timeline since 2013 and down 13% year-over-year, per ATTOM. Faster timelines could mean distressed properties reach auction and REO status sooner than they did in recent years, which may shorten the window real estate investors have to prepare a bid.
The state-level picture is where this data may become most actionable. Florida, South Carolina, and Indiana posted some of the highest foreclosure rates among states, while the largest year-over-year increases in activity showed up primarily in five markets:
- Idaho: Up ~59%
- Colorado: Up ~57%
- Georgia: Up ~52%
- North Carolina: Up ~47%
- Mississippi: Up ~45%
Several of those markets sit in the West and Southeast, where softer pricing has potentially coincided with rising filings. ATTOM framed the increase as a market that may be returning to more typical patterns rather than signaling systemic distress, noting REO volumes remain roughly 26% below first-half 2020 levels. For real estate investors, that context could matter: the uptick may open more sourcing lanes without pointing to a broader downturn.
Kiavi Tip: Running the numbers early tends to help on distressed deals. The ARV and Cash to Close Estimator could give you a fast read on a potential deal before you commit time to a property that may not pencil out.
Why Did U.S. Home Prices Hit a Record High in June?
The median U.S. home-sale price rose 2.2% year-over-year to a record $408,776 in June. Existing-home sales reached their highest level since 2022.
National housing data points to prices and sales both improving in June. The median sale price rose 2.2% year-over-year to an all-time high of $408,776, and existing-home sales ticked up to a seasonally adjusted annual rate of roughly 4.4 million, the highest level since November 2022 and up 4.2% from a year earlier, according to Redfin. Pending home sales reached their second-highest level since 2023, which may suggest the buyer pool for flipped homes is holding up as summer progresses.
Redfin attributed much of the record price to picking-up demand, though it also noted that in much of the country there are still more sellers than buyers. That combination could keep negotiating leverage tilted toward buyers in many submarkets even as headline prices set records, which may support more favorable entry pricing for real estate investors in higher-inventory metros.
|
Market Indicator |
June 2026 |
YOY Change |
|
Median sale price |
$408,776 |
+2.2% |
|
Existing-home sales (SAAR) |
~4.4 million |
+4.2% |
|
Pending home sales |
Highest since 2023 (ex. April) |
+4.5% |
|
New listings |
Lowest since December |
-1% MOM |
Source: Redfin, July 2026
Regional divergence remained the story. Median sale prices rose most in San Francisco (up 9.2%), Pittsburgh (up 9.1%), and West Palm Beach (up 8.6%), while they fell most in Seattle (down 4.9%), San Jose (down 3.9%), and Portland (down 1.8%), per Redfin. Closed sales rose roughly 23% year-over-year in both San Francisco and West Palm Beach, where luxury activity may have helped lift the overall numbers.
On the financing side, the 30-year fixed-rate mortgage averaged 6.55% as of mid-July, up slightly for the week but roughly 20 basis points below the same week one year earlier, per Freddie Mac. This may be buyer-pool context rather than a read on private lending costs: rates in the mid-6% range may potentially compress the qualified buyer pool at the entry and mid-price tiers where many flips transact, and the year-over-year improvement may offer a modest tailwind for exit demand.
Kiavi Tip: For flippers weighing where exit conditions may be most favorable, supply-constrained coastal and Midwest markets have tended to show steadier demand than higher-supply Sun Belt metros. A quick screen like the 70% rule for house flipping could help pressure-test a deal before you commit, and fix-and-flip financing can help you move quickly when the numbers clear.
What Falling Apartment Supply May Mean for Rental Holds
U.S. apartment occupancy held at 95.5% in the second quarter as annual deliveries dropped below the decade average for the first time in three years.
The national apartment market improved in the second quarter. Net absorption of roughly 187,000 units outpaced seasonal expectations and lifted occupancy to 95.5%, a second consecutive quarterly gain and a level slightly ahead of the decade average, according to RealPage. Effective asking rents rose 1.4% for the quarter, though they remained about 0.2% below year-earlier levels.
The bigger structural shift may be on the supply side: roughly 340,200 units delivered in the year ending the second quarter, the first time annual supply dropped below the decade norm in three years and the sixth straight quarter of declining deliveries.
|
Region |
Q2 Occupancy |
Annual Rent Trend |
Rental Hold Read |
|
Midwest |
~96%+ |
Positive |
Constructive |
|
Northeast / Coastal |
~96%+ |
Positive |
Constructive |
|
West |
~96%+ |
Turning positive |
Improving |
|
South (TX, FL, Southeast) |
Below 95% |
Still declining |
Selective |
Source: RealPage, July 2026
The South appears to be the only region with occupancy below 95% and the only region still posting annual rent declines, as elevated supply from the 2022 to 2025 construction cycle continues to work through, per RealPage. San Antonio recorded one of the steepest annual rent declines among the 50 largest markets, followed by Austin and Denver. Concessions remained widespread, with about a quarter of apartments offering an average concession near 7.6%.
That picture may cut two ways for real estate investors.
- In the near term, Midwest and coastal markets appear to offer the more supportive rental conditions, which aligns with the rental-hold intent captured in the Q1 2026 JBREC and Kiavi Fix and Flip survey, where a record 47% of flippers planned to keep more homes as rentals.
- Second, over a longer horizon, higher-supply Sun Belt markets could tighten as new deliveries taper, which may position patient real estate investors for firmer conditions in 2027 and beyond.
Kiavi Tip: If a hold is on your mind, the buy-and-hold financing solutions page walks through how a longer-term rental strategy could fit alongside your active flips.
*RealPage figures cover multifamily apartments primarily, so single-family rental dynamics at the zip-code level may vary, and local data tends to give a more precise read.
What Are Kiavi's New DSCR Buy Up and Compare Mode Tools?
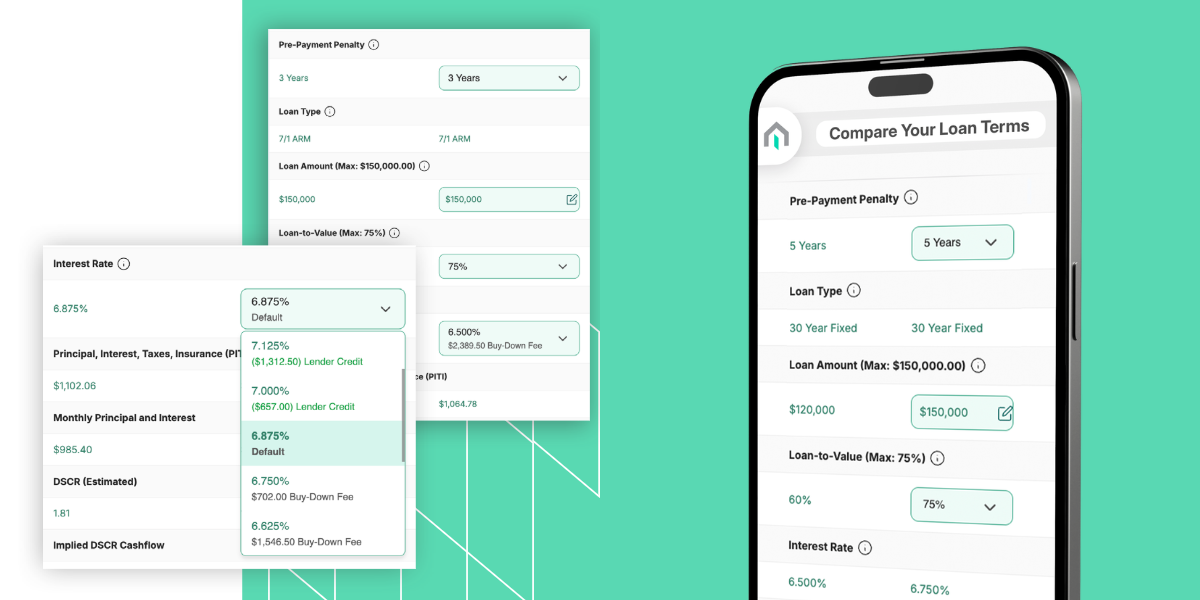
Kiavi rolled out two DSCR platform updates in July 2026 that may give direct borrowers more control over their loan terms: Buy Up / Buy Down and Compare Mode.
Kiavi's DSCR rental loan experience now includes more self-service flexibility for direct borrowers pricing out a loan. The updates are designed to help real estate investors optimize a deal on their own terms rather than waiting on manual quotes:
- Buy Up / Buy Down: choose to pay upfront points for a lower rate, or take a higher rate in exchange for a lender credit, so financing can align with whether you are prioritizing monthly cash flow or lower closing costs.
- Compare Mode: view loan scenarios side by side and adjust inputs like loan amount, LTV, and prepayment penalty, which helps to make it easier to see how different structures could change your numbers before you commit.
Together, these updates put more of the pricing decision in the investor's hands, right at the point where cash flow and closing costs actually get decided. The best way to see the impact is to run your own numbers: the next time you have a DSCR deal ready, you can build and compare scenarios directly on the Kiavi platform and watch how each structure moves your returns before you commit.
*Please note that product features, available options, and loan terms are subject to change without notice. For the most current information and a comprehensive list of features, please visit the Kiavi DSCR Rental Loans page.
In the News: Kiavi Leadership, Awards, and Coverage
Kiavi leadership showed up across the industry in July:
- Arvind Mohan, CEO of Kiavi, sat down with The Elite Officer for an exclusive interview on the future of private lending, and what greater standardization could mean for borrowers, lenders, and brokers.
- Jonathan Mueller, SVP of Product and Technology, was named a Silver winner for Executive of the Year, Financial Technology in the third annual Stevie Awards for Technology Excellence.
- Charles Goodwin, VP and Head of Bridge and DSCR Lending, joined Dave Meyer of BiggerPockets for a webinar, "The State of the Market: How Smart Investors Are Financing in 2026," on how active investors are approaching bridge and DSCR financing right now.
Final Thoughts
June and the mid-year 2026 data pulled in a few directions at once. Home prices set a record and the sales pace was the strongest since 2022, yet there are still potentially more sellers than buyers in much of the country, foreclosure filings are climbing, and apartment fundamentals remain split by region. The through-line may be that market selection is doing more work right now than macro timing, so the local foreclosure pipeline, occupancy trend, and days-on-market in your specific submarket may give you a more useful read than any national average. Real estate investors underwriting a deal right now can price out a loan with Kiavi to start getting those numbers in front of them.
Sources
- Foreclosure Activity Posts Annual Increase in First Half of 2026, ATTOM, July 2026
- U.S. Foreclosure Rates by State: June 2026, ATTOM, July 2026
- U.S. Home Prices Hit an All-Time High in June 2026, Redfin, July 2026
- United States Housing Market Data, Redfin, July 2026
- Second Quarter 2026 Apartment Data Update, RealPage Market Analytics, July 2026
- Mortgage Rates Average 6.55%, Freddie Mac, July 2026
- Blockchain Blockbuster: Top Execs Tout Figure-Kiavi Deal, Scotsman Guide, June 2026
- Meet Scotsman Guide's 2026 Top Mortgage Lenders, Scotsman Guide, June 2026
- Beyond the Acquisition: How Figure and Kiavi Are Building the Future of Private Lending, The Elite Officer, July 2026
- Stevie Awards for Technology Excellence, Stevie Awards, July 2026
%20(1).png)
Explore Related Content

Kiavi Investor Pulse: June 2026 Market and Financing Update
The June 2026 Kiavi Investor Pulse covers the most recent housing market data, the Federal..

The Best Real Estate Investment Strategy for 2026: 3 Approaches Compared
Editor's Note - Updated July 2026: This post has been updated to include a reference toAmerica's..

Mid-Year Fix-and-Flip Market Check: Where Investors Are Winning in 2026
Not every fix-and-flip market is moving the same direction in 2026. Some states entered the..
You are leaving kiavi.com. Do you want to continue?