
Share
The Burns + Kiavi Fix and Flip Housing Market Index (FFMI)™ fell to 59 in the second quarter of 2026, down from 63 in the first quarter, according to the quarterly John Burns Research and Consulting and Kiavi Fix and Flip Survey. All three subindices declined as the 30-year fixed mortgage rate climbed through the quarter, reaching 6.69% by early August. Readings above 50 still indicate market expansion, and the index sits above the 57 recorded one year earlier, though slower exits and softer pricing power may warrant more conservative after-repair value assumptions.
What Does the Fix and Flip Market Index Show for Q2 2026?
The Fix and Flip Market Index registered 59 in the second quarter of 2026, a 4-point decline from 63 in the first quarter, with all three subindices moving lower.
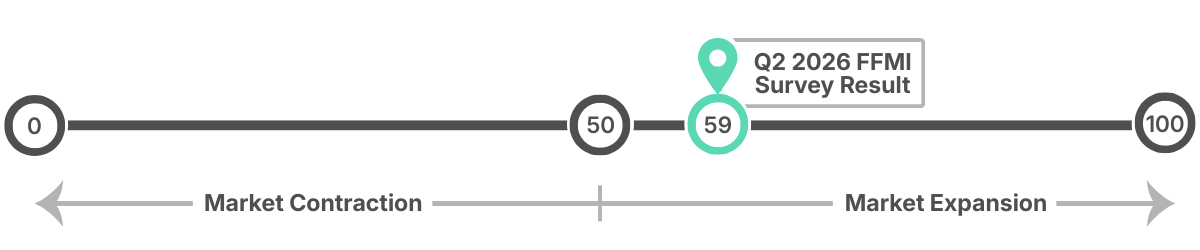
A horizontal index scale displaying market contraction on the left, market expansion on the right, and a teal pin indicating the Q2 2026 JBREC + Kiavi FFMI survey result at 59.
The FFMI is a sentiment index built from a proprietary quarterly survey by John Burns Research and Consulting and Kiavi, of roughly 275 active flippers nationwide. It does not measure how many homes were flipped. It measures how current conditions compare against seasonal norms across three specific fundamentals, which is why it can decline in a quarter when transaction counts are stable, and rise in a quarter when they are not.
|
Subindex |
Q2 2025 |
Q1 2026 |
Q2 2026 |
What it measures |
|
Current flipped home sales |
57 |
62 |
57 |
Sales versus seasonal expectations |
|
Expected sales, next 6 months |
57 |
66 |
61 |
Forward sentiment over six months |
|
Availability of pre-flip homes |
61 |
64 |
61 |
Competition for acquisitions |
|
Overall index |
57 |
63 |
59 |
Composite of the three above |
Source: JBREC and Kiavi Fix and Flip Survey, August 2026
How to Read a Diffusion Index
A diffusion index measures direction, not magnitude. It tells you what share of respondents report improving versus deteriorating conditions, and it deliberately discards how much better or worse things got.
- Above 50: more flippers report conditions better than the seasonal norm than report them worse
- At 50: the two groups are balanced, which the index treats as flat
- Below 50: more flippers report conditions worse than the seasonal norm
So a reading of 59 does not mean the market is 59% healthy. It means expansion is still the majority report, and a move from 63 to 59 says that majority got smaller, not that activity fell 4%.
Kiavi Tip: Read the FFMI for direction and the subindices for cause. The overall number tells you sentiment may have shifted; the three subindices tell you whether it was demand, forward expectations, or acquisition competition.
How Has the Fix and Flip Market Trended Over the Past Year?
The FFMI has moved in a narrow band over the past six quarters, bottoming at 56 in the third quarter of 2025 before climbing two consecutive quarters to a cycle high of 63 in the first quarter of 2026, then easing to 59 this quarter.
|
Quarter |
FFMI |
|
Q1 2025 |
58 |
|
Q2 2025 |
57 |
|
Q3 2025 |
56 |
|
Q4 2025 |
62 |
|
Q1 2026 |
63 |
|
Q2 2026 |
59 |
Source: John Burns Research and Consulting, LLC, and Kiavi, quarterly survey series, 2025-2026
Every quarter in this window has stayed above the 50 expansion threshold, so the underlying story is one of degree, not direction. The two-quarter run-up into Q1 2026 reflected improving sentiment across all three subindices, and the Q2 2026 pullback discussed above reversed only part of that gain rather than erasing it.
Kiavi Tip: A single quarter's reading tells you direction. Reading it against the prior four to six quarters tells you whether that direction is a trend or noise. The Q2 2026 pullback follows two quarters of gains, which is a different signal than a pullback following a year of steady decline.
What the Flipper-Size Split Shows
Underneath the headline number, 34% of flippers rated current sales as good compared to seasonal norms, down from 37% in the first quarter reading, while 20% rated them poor.
The survey also segmented sentiment by transaction volume for the first time, defining large flippers as those who bought or sold 8 or more homes in the last 18 months. Large flippers again rated conditions more favorably than smaller operators, though the gap narrowed this quarter. Several advantages may sit behind that persistent spread:
- Financing terms that tend to improve for repeat borrowers with a track record
- Established contractor relationships that could reduce both bid volatility and schedule slippage
- Access to off-market and wholesale deal flow that never reaches the MLS
None of those are typically available on a first project. For a newer fix-and-flip investor, the gap is a reminder that the operators reporting better conditions may be operating with structural advantages rather than better markets.
Why Are Flipped Homes Taking Longer to Sell in 2026?
Roughly 59% of flippers reported an increase in days on market in the second quarter of 2026 relative to the first, and the pressure appeared to be concentrated in specific regions rather than spread evenly.
At the same time, 16% of flippers reported days on market improving, the highest share in three years. That split could be the most important nuance in the quarter, because a national average may substantially understate what a hold period looks like in the regions carrying the most pressure.
|
Region |
Share reporting longer days on market |
|
Northwest |
83% |
|
Texas |
75% |
|
Southeast |
66% |
|
Florida |
65% |
|
National |
59% |
|
Southwest |
56% |
|
Northeast |
55% |
|
Midwest |
54% |
|
Northern California |
31% |
Source: JBREC and Kiavi Fix and Flip Survey, August 2026
The broader resale market tells a different story, which is precisely why flipper-level data could be worth tracking separately. Redfin put the national median days on market at 41 days in the four weeks ending August 2, essentially flat year-over-year, with 21.5% of listings carrying a price drop.
What this could mean: flipped homes typically concentrate in specific price bands and metros, so a flat national median could coexist with real lengthening at the flipper level.
Kiavi Tip: If you are underwriting off broad market statistics, you may be modeling a market that your specific product is not competing in. Market-level selection may matter more this year than in 2024, when most regions moved together.
What Longer Days on Market Actually Costs
Extra time at exit typically shows up as carrying cost, not as a headline. The following example assumes a project with total monthly carrying cost of $3,800 covering debt service and standard holding expense, against a base-case margin of $30,000.
Example (hypothetical):
|
Additional time on market |
Added carrying cost |
Share of base-case margin consumed |
|
30 days |
$3,800 |
13% |
|
60 days |
$7,600 |
25% |
|
90 days |
$11,400 |
38% |
Source: Hypothetical example, Kiavi, August 2026. Actual terms vary by lender, market, and deal specifics.
One quarter of lengthening consumes roughly a quarter of the margin on a project like this, before any price reduction is negotiated. That is why a slow exit and a discounted exit tend to arrive together: the carrying cost pressure is what could make the price concession feel necessary. Comparable sales from earlier in the year could understate time-to-sell in the regions above, and renovation timelines that slip may add to the same exposure from the front end.
Kiavi Tip: Build your hold assumption from current listing-to-close data in your specific submarket, not from the comps that closed when you acquired the property.
How Many Flippers Sold Below Their ARV Estimates in Q2 2026?
About 21% of flippers reported selling mostly below their initial after-repair value estimate in Q2 2026, up from 17% in the prior quarter, while 16% sold mostly above.
That produces a net reading of roughly negative 5%, meaning slightly more flippers missed their ARV targets than exceeded them. Pricing power had been firming across several prior quarters before reversing, which makes this the clearest inflection in the quarter.
| After-repair value (ARV) is the estimated market value of a property once renovations are complete. It is the number a fix-and-flip investor underwrites backward from, because both the maximum purchase price and the target margin derive from it. An ARV that is wrong by 5% is not a 5% problem, because the entire deal was sized against it. |
After-repair value (ARV) is the estimated market value of a property once renovations are complete. It is the number a fix-and-flip investor underwrites backward from, because both the maximum purchase price and the target margin derive from it. An ARV that is wrong by 5% is not a 5% problem, because the entire deal was sized against it.
Among flippers who came in below ARV, the reported causes were lopsided:
- 91% overestimated the sale price. The exit assumption, not the budget, was the primary miss.
- 57% underestimated costs. Budget overruns contributed but were the secondary factor.
Acquisition discipline appeared to move the opposite way. Flippers reported willingness to pay up to 68% of ARV on average, versus 66% one year ago, though 73% still cap purchases at 70% of ARV or less. Paying more of ARV while exit pricing softens compresses the cushion that absorbs a slow sale.
Kiavi Tip: Since 91% of below-ARV misses in Q2 2026 traced back to an optimistic exit price rather than the renovation budget, real estate investors may get more mileage from stress-testing the sale price assumption in an ARV estimator before adjusting the rehab number.
Where Exit Pricing Held Up and Where It Did Not
Regional dispersion in ARV performance was wide enough that a national net reading has limited planning value.
|
Exit pricing read |
Regions |
|
More flippers surveyed in Q2 2026 sold below ARV than above |
Southwest, Northwest, Florida, Texas, Southeast |
|
More flippers surveyed in Q2 2026 sold above ARV than below |
Northern California, Midwest |
Source: JBREC and Kiavi Fix and Flip Survey, August 2026
What this could mean: in the five regions in the top row (Southwest, Northwest, Florida, Texas, Southeast), underwriting to a forward ARV that assumes continued softness over the hold period may protect margin better than underwriting to current comparable sales. In Northern California and the Midwest, competition for deals could be more likely to be the binding constraint than exit pricing, which may shift the discipline from the sell side to the buy side.
What Are 3 Percentage Points of ARV Actually Worth?
Moving the entry price from 68% of ARV to 65% could be worth roughly $13,500 of protected margin on a $450,000 project, which may be more than most rehab contingencies cover.
Example (hypothetical): A fix-and-flip investor underwrites a project at the national average flipped home price and the national average renovation budget, then models an exit 5% below ARV with 30 extra days of carry.
|
Line item |
Base case |
Exit 5% below ARV |
|
Estimated ARV |
$450,000 |
$450,000 |
|
Purchase price at 68% of ARV |
$306,000 |
$306,000 |
|
Renovation budget |
$69,000 |
$69,000 |
|
Financing, carrying, and selling costs |
$45,000 |
$50,000 |
|
Total project cost |
$420,000 |
$425,000 |
|
Sale price |
$450,000 |
$427,500 |
|
Gross margin |
$30,000 |
$2,500 |
Source: Hypothetical example, Kiavi, August 2026. Actual terms vary by lender, market, and deal specifics.
In this hypothetical example, purchasing the same property at 65% of ARV instead of 68% drops the purchase price to $292,500 and leaves roughly $16,000 of margin in that downside case rather than $2,500. Three percentage points at acquisition is doing almost all of the work, which is why the entry number may deserve more scrutiny than the list price does later.
"The projects that tend to run into trouble are rarely the ones with a bad rehab budget. More often, it's the exit number that was set months earlier and never revisited, sometimes because the investor stretched for the ARV instead of underwriting to realistic comps with some cushion built in. Investors who don't stretch for the ARV in the first place tend to have more room to work with if the market shifts."
Charles Goodwin, Head of Bridge and DSCR Lending, Kiavi
Kiavi's ARV and cash-to-close estimator is one way to pressure-test an entry point, and a pre-purchase diligence checklist covers what to verify before the ARV is committed to.
Kiavi Tip: Re-run your ARV against the three most recent closed comparables in the subject property's own submarket before submitting an offer, not after the renovation is finished.
Why Did Average Renovation Costs Fall to $69K per Flip?
Average renovation spend per flipped home fell to $69K, according to the survey, in the second quarter of 2026 from $79K in the first quarter, and renovations accounted for 15% of the average sale price, down from 17% one year earlier.
Half of surveyed flippers spent between $30K and $70K per project. The regional spread remains wide, and the two columns below may tell different stories: absolute spend tracks local labor costs, while spend as a share of sale price tracks how much value the local exit price can actually support.
|
Region |
Average renovation cost |
Renovation as share of sale price |
|
Northwest |
$139K |
12% |
|
Northern California |
$129K |
10% |
|
Southern California |
$74K |
10% |
|
Northeast |
$70K |
17% |
|
National |
$69K |
15% |
|
Midwest |
$66K |
25% |
|
Florida |
$62K |
16% |
|
Southwest |
$58K |
12% |
|
Southeast |
$51K |
17% |
|
Texas |
$44K |
17% |
Source: JBREC and Kiavi Fix and Flip Survey, August 2026
What this could mean: the Midwest may be the outlier worth studying. Renovations there represent 25% of sale price for surveyed participants, the highest of any region, on the second-lowest absolute budget. Older housing stock priced against lower exit values may mean rehab scope consumes a much larger share of the deal, so a 20% budget overrun in the Midwest could damage the margin far more than the same percentage overrun in Northern California.
What Light, Moderate, and Heavy Scope Actually Mean
Scope of work held steady rather than shifting, and the survey uses three defined tiers that may be worth knowing because lenders and appraisers tend to think in similar terms.
|
Scope tier |
What it typically involves |
Share of flippers |
|
Light |
Mainly cosmetic updates such as paint, flooring, fixtures, and surface finishes |
9% |
|
Moderate |
Kitchen and bath updates, partial mechanical work, or minor reconfiguration |
66% |
|
Heavy |
Major systems, structural, or full-gut work including rewiring, replumbing, HVAC replacement, and additions |
25% |
Source: JBREC and Kiavi Fix and Flip Survey, August 2026
Compared with a year ago, roughly equal shares of flippers reported moving heavier and moving lighter, so the national picture may be closer to flat than to a broad pullback. The change appears to be happening at the edges. Flippers who already specialize in heavy renovations were more likely to increase intensity, while light-touch operators were more likely to scale back. That pattern could gradually pull the two ends of the market apart rather than shift the middle.
The spend data also lines up with a wider trend. Harvard's Joint Center for Housing Studies projects year-over-year growth in home improvement and repair spending slowing to 0.5% by the second quarter of 2027, reaching $519 billion. With flipped home transactions also down 11.3% year-over-year across the 103 metros the survey tracks, the fix-and-flip share of renovation spending may decline in the near term. Anyone building a rehab budget against last year's quotes may want to recheck current rehab cost benchmarks before locking scope.
Kiavi Tip: Rebid your two largest line items against current quotes before closing. Falling average spend nationally does not mean your specific trades repriced downward.
Who Is Buying Flipped Homes and at What Price Points?
Entry-level buyers purchased roughly 51% of flipped homes in the second quarter of 2026, according to the survey, and other real estate investors accounted for about 15%, which makes the sub-$500K owner-occupant band the primary exit for most projects.
|
Buyer type |
Average purchase price |
Average renovation spend |
|
Another flipper |
$278K |
$39K |
|
Institutional investor |
$346K |
$42K |
|
Mom-and-pop investor |
$339K |
$50K |
|
Entry-level buyer |
$406K |
$60K |
|
Move-up buyer |
$525K |
$68K |
|
Vacation or second home |
$531K |
$77K |
|
Luxury buyer |
$817K |
$132K |
Source: JBREC and Kiavi Fix and Flip Survey, August 2026
Two patterns stand out:
- Investor buyers typically pay less and receive less finished work, which is consistent with buying earlier in the process and completing the remaining scope themselves.
- Luxury and vacation buyers typically command renovation spend more than double the entry-level figure, because larger homes and higher-grade materials are what those price points require.
What this could mean: if your exit is the entry-level band, spending toward the move-up renovation budget may not be recoverable in the sale price. Over-improving relative to the buyer you will actually reach is one of the more common ways margin gets left on the table, and it is also one of the more preventable ones.
Kiavi Tip: Identify your likely buyer type before finalizing the scope of work, then set finish level to that band rather than to the nicest comparable in the neighborhood.
How Should Real Estate Investors Underwrite the Rest of 2026?
One of the most actionable reads from the Q2 2026 JBREC + Kiavi Fix and Flip Survey is that exit assumptions may deserve more scrutiny than acquisition assumptions right now, because the data shows pricing softness arriving faster than deal flow is drying up.
Financing conditions could offer some offset. Roughly 59% of surveyed flippers secured new loans in Q2 2026, the highest share in two years, and effective rates reported by survey participants continued to compress slowly.
|
Active State |
The Q2 Data Suggeests |
Potential Fix |
|
Texas or the Southeast |
More flippers rated sales poor than good; Texas forward sentiment tilted negative |
Underwrite to a forward ARV assuming continued softness, not to current comps |
|
Northwest |
83% reported longer days on market, the highest of any region |
Extend the hold assumption before adjusting the rehab contingency |
|
Midwest or Northern California |
The only regions where more flippers sold above ARV than below |
Expect acquisition competition to be the constraint, not exit pricing |
|
Southwest |
High deal competition alongside weaker ARV performance |
Discipline on entry price may matter more than speed to close |
Source: Kiavi, August 2026
Beyond geography, three decision points may apply broadly:
- If your exit timeline was set earlier this year: roughly 59% of flippers saw days on market lengthen last quarter. Adding carry months to the model may be more useful than adding a contingency line to the rehab budget.
- If a sale is not clearing at your target price: a rental hold is a real option but not automatically the better outcome. National median rent was $1,388 in July 2026, down 1.1% year-over-year, so the pivot needs to pencil on current rents.
- If you are underwriting a new acquisition: the 3-point ARV example above may be the cheapest available protection against everything else in this report.
There is a lending-side signal worth naming, and it comes from what a slow exit actually looks like operationally. In Kiavi's lending experience, slower sales tend to surface first as extension requests and refinances into rental loans rather than as missed payments, which means loan pool aging may often move well before delinquency does. A flipper who flags a slow exit early could usually have more workable options than one who waits until a maturity date is close.
For fix-and-flip investors weighing that decision, structuring a bridge loan alongside a potential rental exit before acquisition tends to be easier than restructuring mid-project.
Kiavi Tip: If a project is trending past its expected payoff date, consider raising it with your lender before the final 30 days rather than after.
Final Thoughts
Q2 2026 marked a sixth straight quarter of the JBREC + Kiavi Fix and Flip Market Index holding above the 50 expansion threshold, and the reading remains above where it sat a year ago. Longer exits and a higher share of below-ARV sales may suggest the margin for optimistic underwriting has narrowed, but the underlying trend is one of moderation, not reversal. Real estate investors who tighten entry pricing and lengthen hold assumptions may be better positioned than those adjusting after a listing goes stale.
If you are sizing a deal against these conditions, you can price out a fix-and-flip loan in minutes.
Sources
- Fix and Flip Survey, John Burns Research and Consulting and Kiavi, August 2026
- Primary Mortgage Market Survey, Freddie Mac, August 2026
- Pending Home Sales Sink to 5-Month Low As Mortgage Rates Rise, Redfin, August 2026
- Remodeling Spending Poised for Further Slowdown, Harvard Joint Center for Housing Studies, July 2026
- Apartment List National Rent Report, Apartment List, July 2026
- JBREC + Kiavi Q1 2026 Fix and Flip Survey, Kiavi, May 2026
- JBREC + Kiavi Q4 2025 Fix and Flip Survey, Kiavi, February 2026
%20(1).png)
Explore Related Content

How to Choose the Right Financing for Your First Real Estate Investment
Choosing financing for a first real estate investment often comes down to matching the loan to..

JBREC + Kiavi Q1 2026 Fix and Flip Survey: What the Data Says About the Market Right Now
Editor's Note - Updated June 2026: This post has been updated to include a reference to..

Is the Rate Lock Effect Fading? What That Means for Investors in 2026
The mortgage rate lock-in effect has kept millions of homeowners in place since 2022, but its..
You are leaving kiavi.com. Do you want to continue?